Go to Homepage
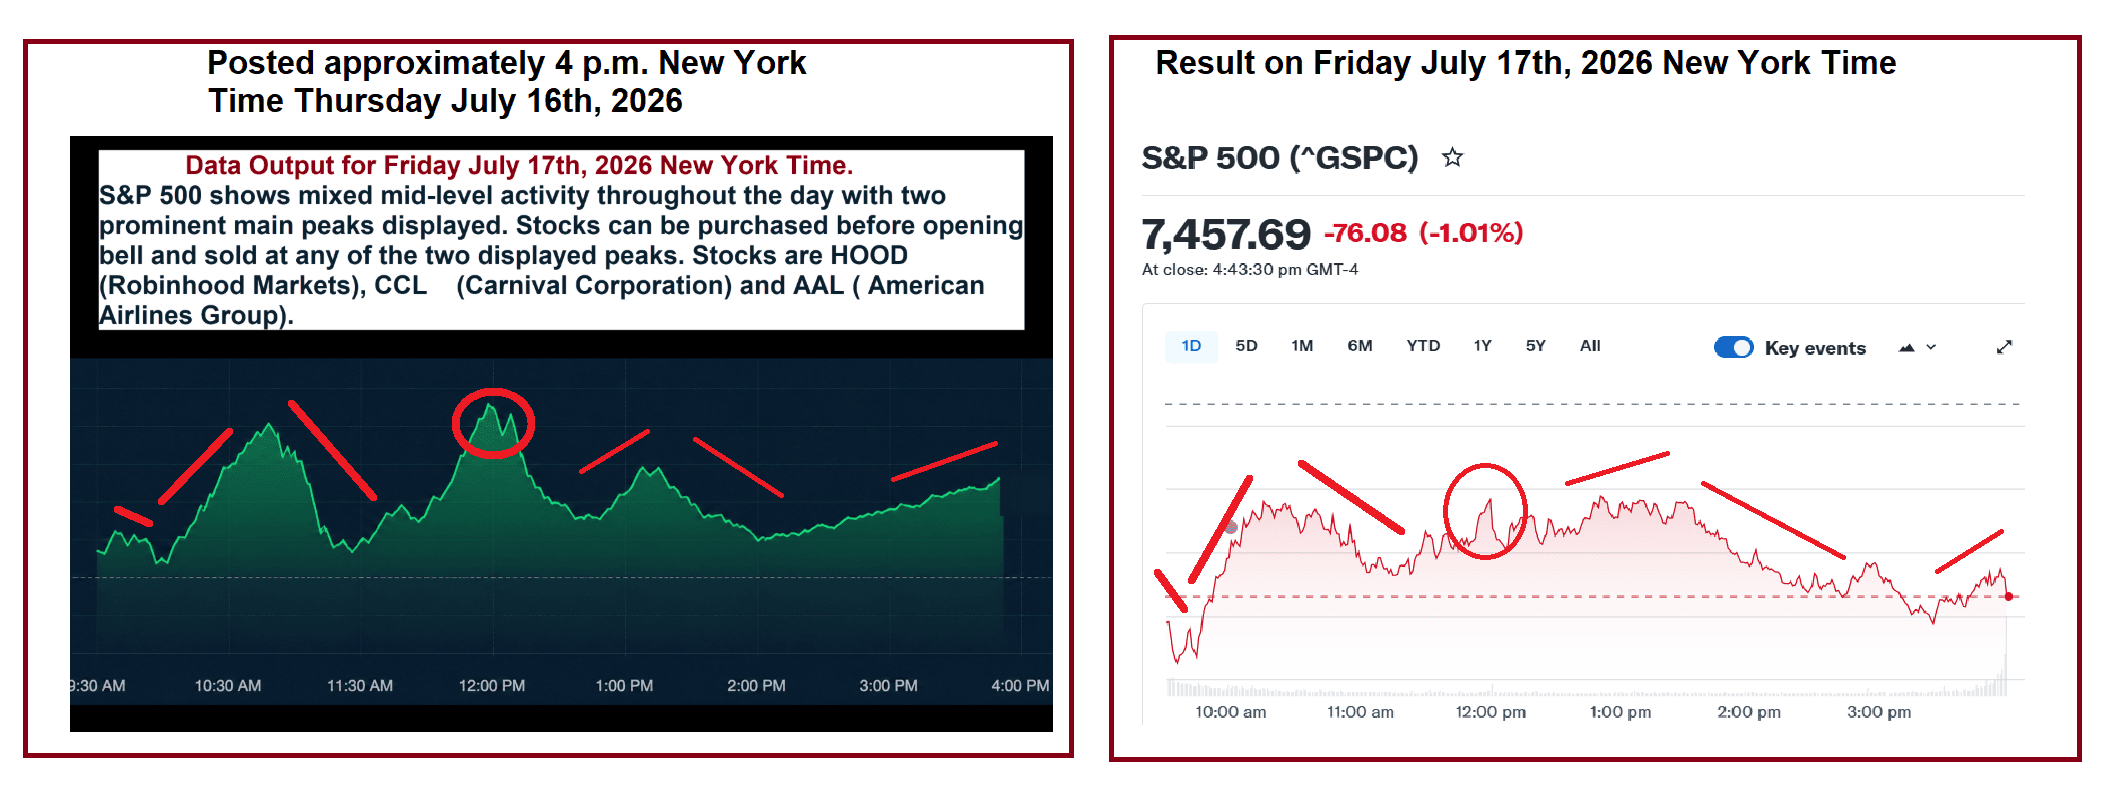
Results: 100% profit overall as long as stocks were purchased at 9:30 a.m. and sold at 12 noon sharp.
Also the stocks that we had been listing were primarly of the S&P 500. However we took a risk with American Airlines (AAL). However it is no longer in the S&P 500 and was kicked out of the S&P 500 on Sept 23rd, 2024.
Formation: Perfect formation. Although the overal layout was a little more sharper in contrast with more sharp elevated peaks and lows, compared to the actual result. This over exaggerated activity may have been from the mild interferrence.
Peak Formation Analysis
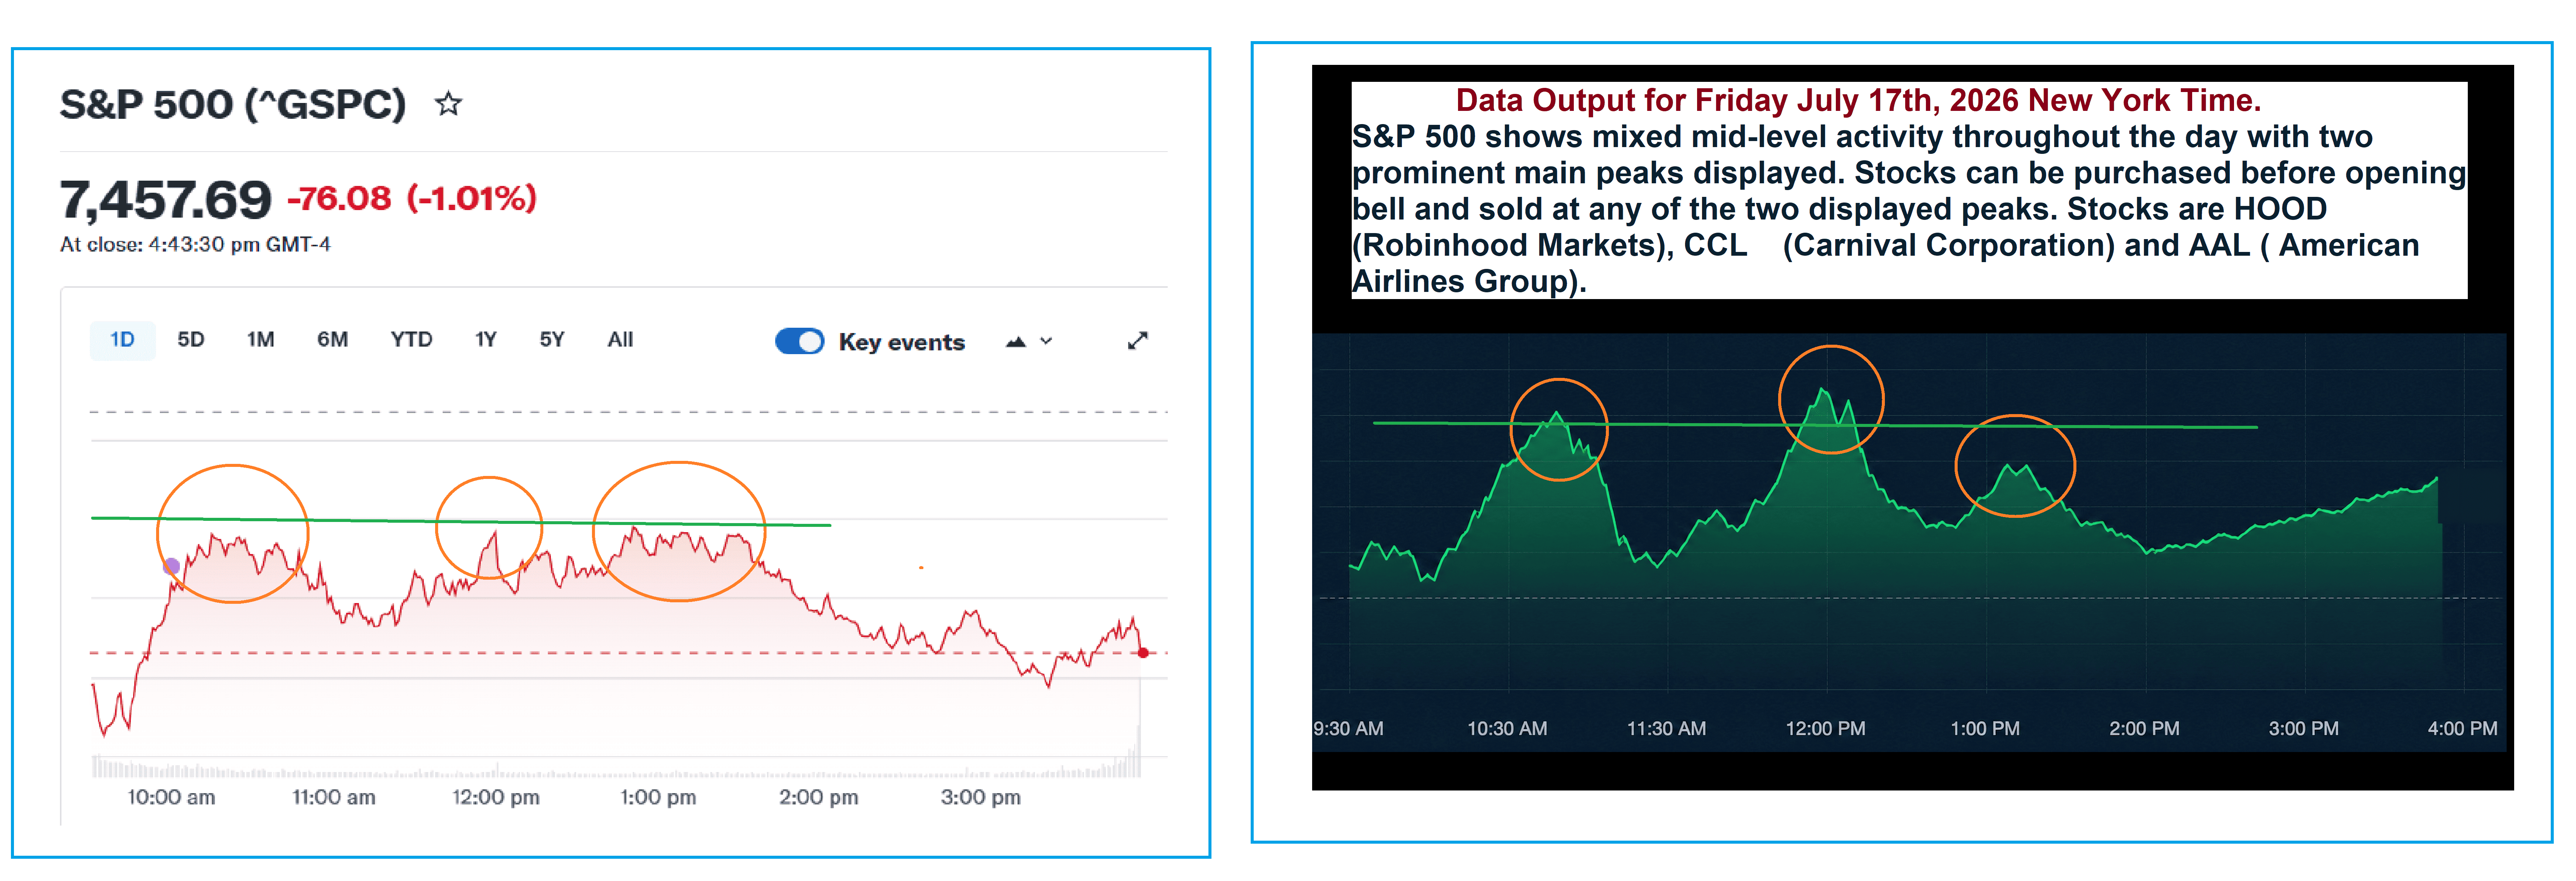
The three peaks matched perfectly. Except for the last peak, which was slightly shorter and less spread out and the two peaks at the end were not in the beta test image.
Profit / Loss Analysis:
As shown on the beta test chart 12 p.m. was the exact peak of trading. So let's explore the data to see if a profit was made
Purchasing $1,000 worth of the following stocks at 9:30 a.m. on Friday, July 17th, 2026 New York Time and selling them at the 12 p.m. peak, what would have been the profit and loss for each stock?
SPY (S&P 500 Stock) - 9:30 a.m. - buy at 7447.52. 12 p.m. - sell at 7494.75
HOOD (Robinhood Markets) - 9:30 a.m. - Buy at 100.12. 12 p.m. - sell at 102.27
CCL (Carnival Corporation) - 9:30 a.m. - Buy at 26.01. 12 p.m. - sell at 26.50
AAL ( American Airlines Group) - 9:30 a.m. - Buy at 15.22. 12 p.m. - sell 15.07

Totals: $4,000 invested → net profit of +$36.79 (about +0.92% across the four positions)
More profit would have been made if all stocks listed were in the S&P 500. Of which American Airlines was not (AAL). So from now on we will list only stocks that are in the S&P 500 as these get the very best results.
There was mild interferrence during this test. However the future stability of the solar wind speed and the mild increase in cosmic rays stablized the time-line. This shows that our technology is now able to overcome mild interferrence; a major breakthrough after years of research.
Geomagnetic and Solar Activity
Geomagnetic Activty: In the sweet spot.

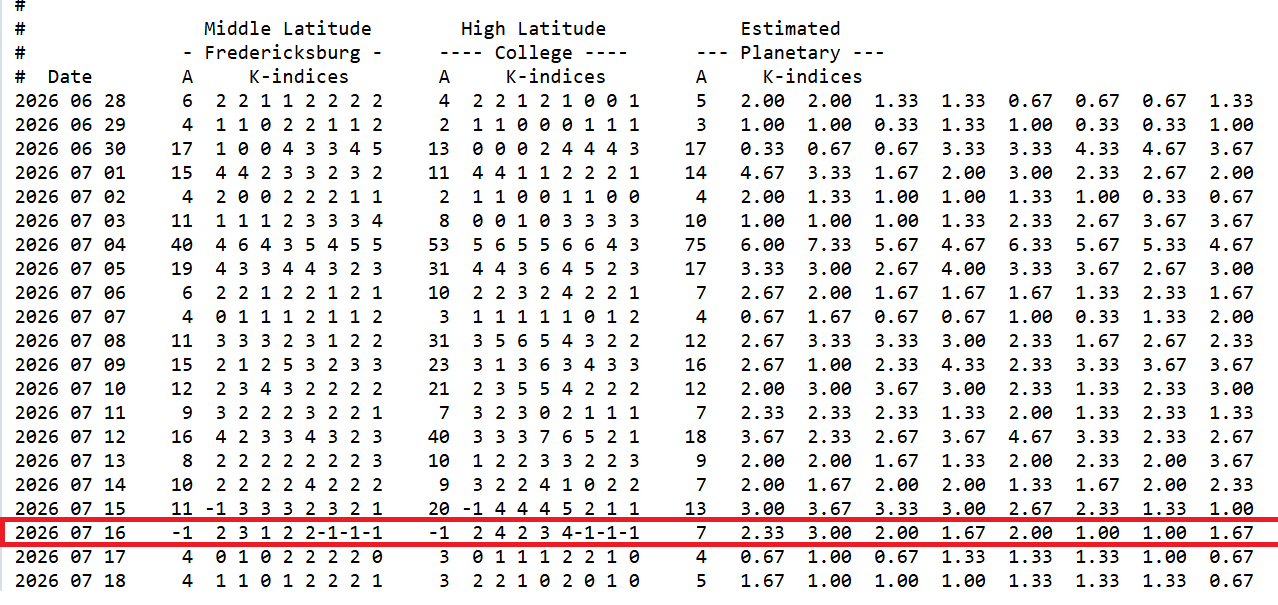
When I made this report on the 17th, the KP values had not been filled in yet.
Still as of July 28th, 2026 the values have not been fully filled in. However
we can see that the Estimated Planetary K-Indices do show a lower value
so we can assume taht the KP sweet spot was present on that day.
As of August 3rd, 2026, the geomagnetic information for the 17th of Juy is still offline. After e-mailing NOAA SWPC Customer Support, I received the following response:
"The answer is that we were not receiving data from these locations that day. Once that day's data is saved in the database, we don't have a way to go in and edit it after that day."
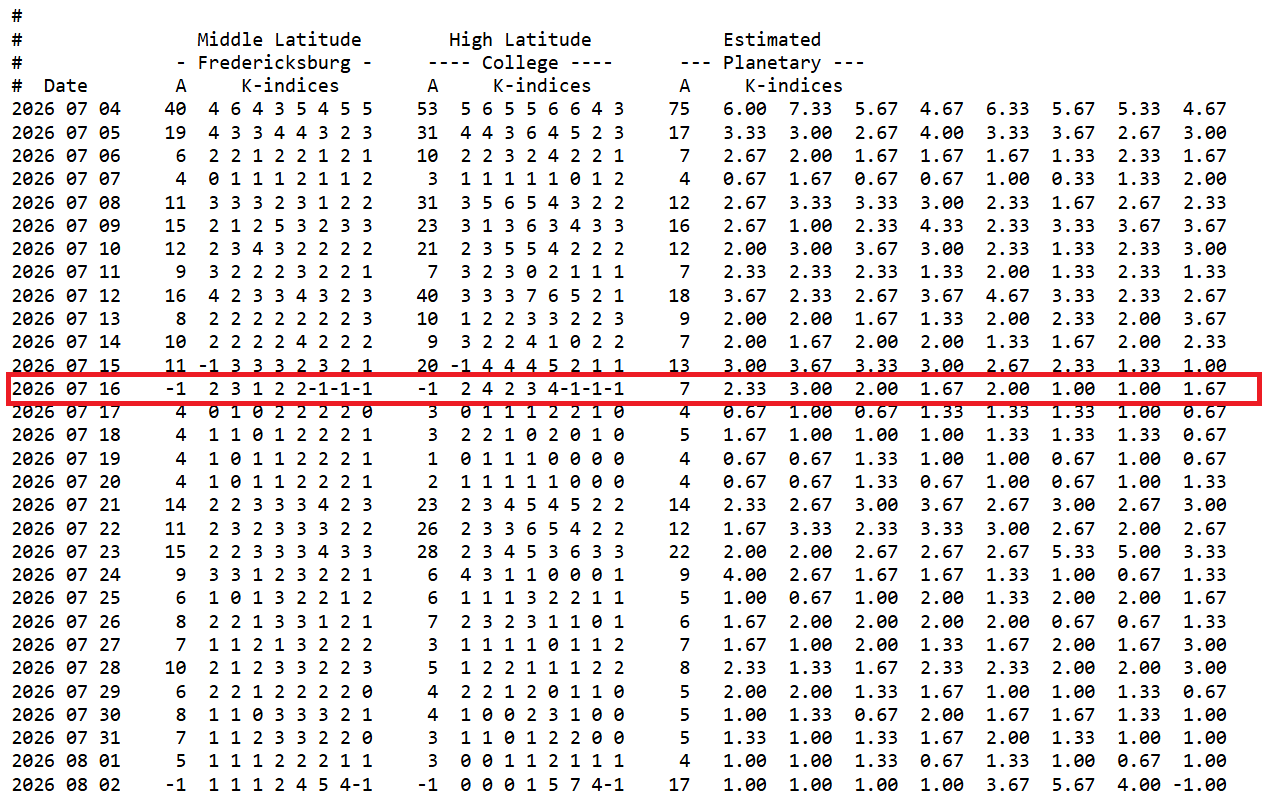
I was able to find the data for the 16th of July from the WDC center fro Geomagnetism
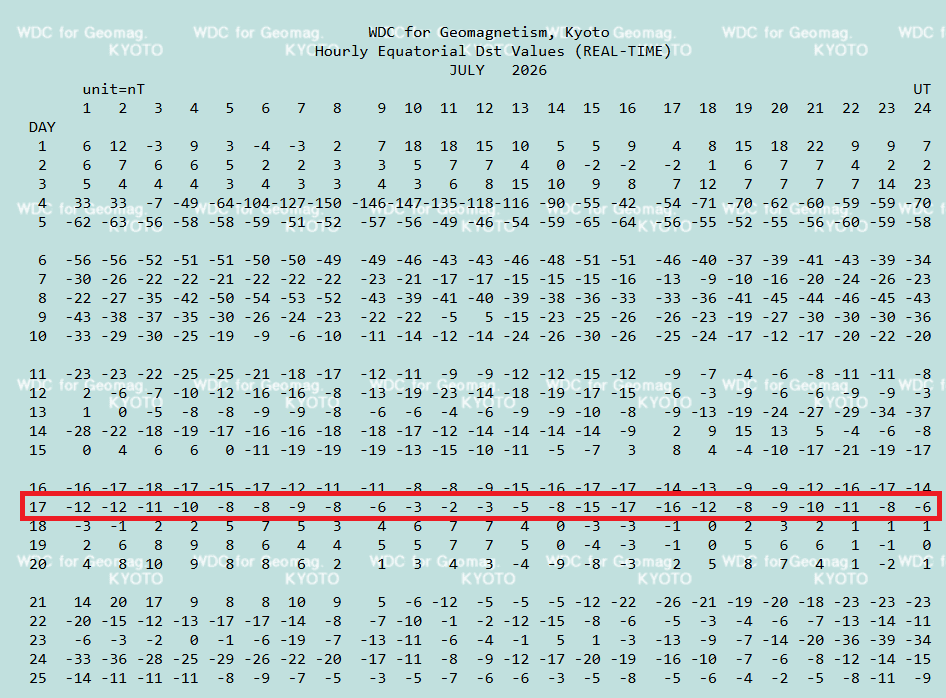
The Canada geomagnetic website shows that geomagnetic activity was not forecast to increase and this lead to the time-line stability.
Real Time KP Activity

There were no Solar Flares, which also caused mild interferrence as solar flares also seem to boost the signal.
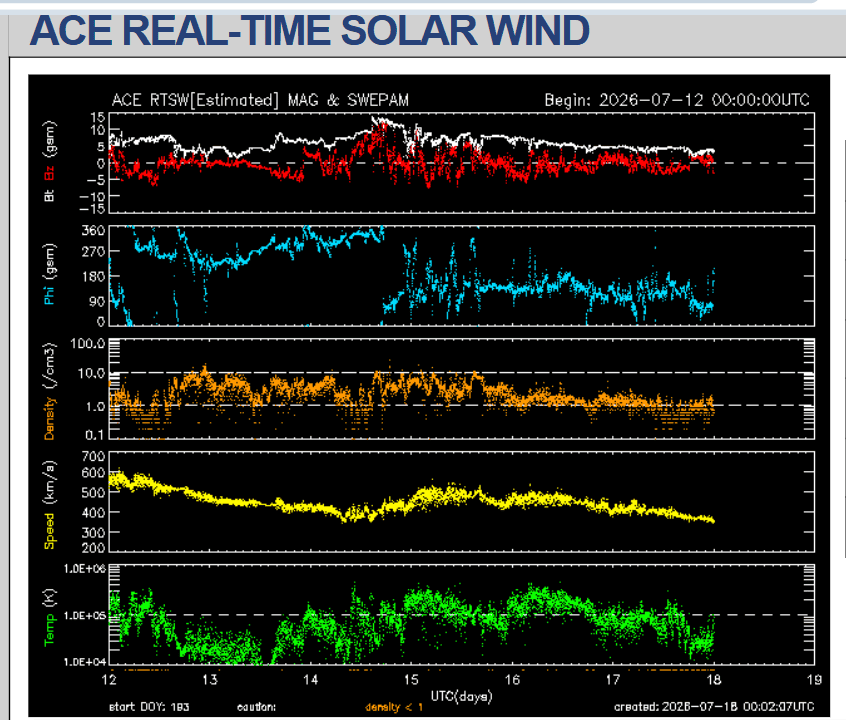
Future Solar Wind Speed Prediction also shows stability showing that time-line stability was stable.

Real Time Solar Wind Speed
Real Time Cosmic Ray Activity had been increasing with a slight dip on the beta test date also leading to a weaker signal.

Real Time Solar Wind speed was elevated during the session on the 17th at around 470, but had been forecast stable heading into the sweet spot in the coming days.
View Original beta test image


Totals: $4,000 invested would yield a net profit of +$36.79
(about +0.92% across the four positions)
Totals: $4 Million invested would yield a net profit of +$36,799.40
(about +0.92% across the four positions).
Moving $1M into a stock like AAL or CCL at the open, and back out at noon, could itself move the price (slippage and market impact), so actual fills would likely be less favorable than these clean quoted-price calculations suggest. SPY, being far more liquid, would handle that size with minimal impact.
Go to Homepage