Data Analysis for
Thursday August 13th, 2026. S&P 500 Activity.
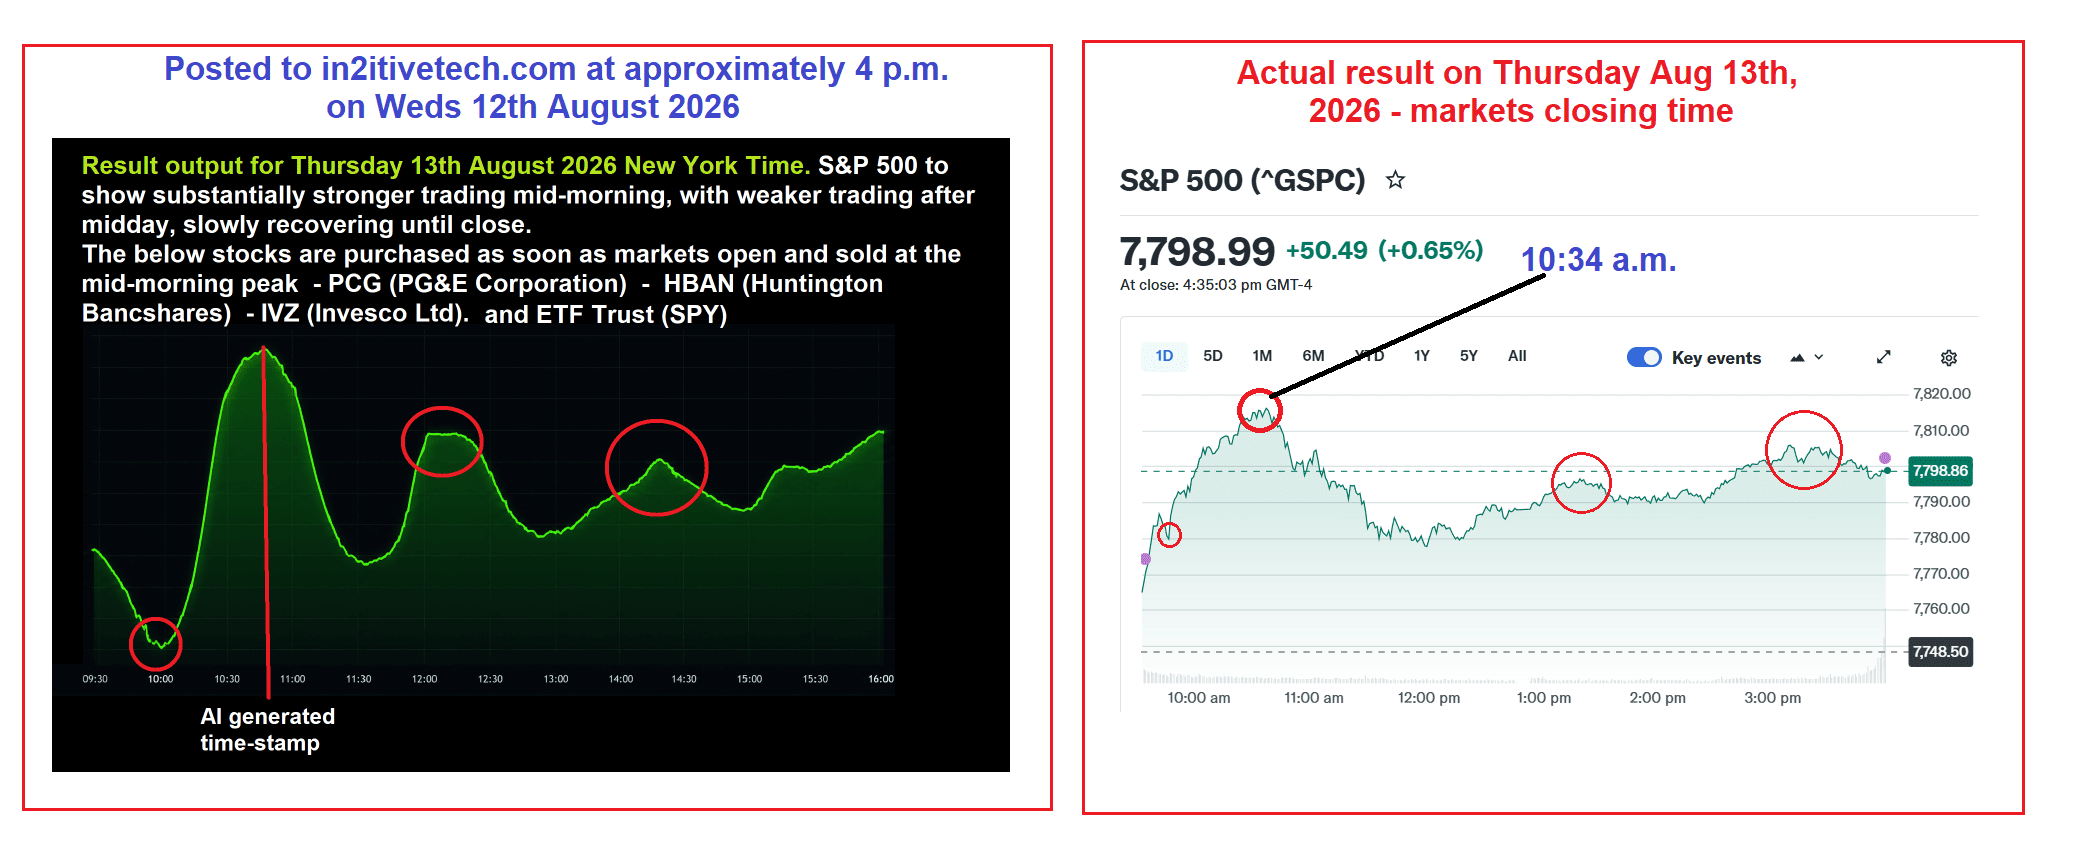
Result: 100% Perfect. If a purchase of the stocks had been made at opening bell and sold at 10:30 a.m. a profit would have been made. Even more profit would have been made if the stocks were sold at the end of the day. This data output was unique in that the S&P 500 activity was different from the average in that there was a surge of activty in the morning. This means that the data that we use is not an overal consistent average of activity. It means that it is constantly plotting the actual result up to 24 hours into the future.
As for the overall wave formation, it appeared too rough. Kind of sawtooth like. In future outputs we may use AI to smooth this out some more.
One other interesting feature is the fact that using AI time-stamps has proven to be very successful. At least for the first 2 hours of trading. This feature we will continue to incorporate into the output, but with a disclaimer that it is AI generated only. The waveform is really what counts and is what is actually used for the sell point.
The first main peak occured at exactly 10:34 a.m. The 2 other peaks occured thereafter. However the last hour was inconsistent with the data outpout. The overall waveform in the data ouput shows the S&P 500 closing higher, of which it did. Currently there exist 2 weaknesses in the data output. In the data output, the waveform of the two remaining peaks appear too close to one another and the last hour and 90 minutes or so the waveform is inconsistent. This may be due to the fact that cosmic ray count was lower during this particular day. Now, let's get into the numbers.
| Stock | Buy Price | Shares Bought | Sell Price | Profit/Loss |
|---|---|---|---|---|
| SPY | $777.94 | 1,285.16 shares | $779.37 | +$1,837.98 ✅ |
| PCG | $17.37 | 57,570.52 shares | $17.33 | −$2,302.82 ðŸâ€Â´ |
| HBAN | $17.77 | 56,274.62 shares | $17.83 | +$3,376.48 ✅ |
| IVZ | $31.22 | 32,031.39 shares | $31.48 | +$8,328.16 ✅ |
Net Total Profit made in approximately 1 hour +$11,239.80
What if the stocks had been sold
at the end of the trading day?
| Stock | Buy Price | Shares Bought | Sell Price | Profit/Loss |
|---|---|---|---|---|
| SPY | $777.94 | 1,285.16 shares | $772.83 | −$6,566.77 ðŸâ€Â´ |
| PCG | $17.37 | 57,570.52 shares | $17.33 | −$2,302.82 ðŸâ€Â´ |
| HBAN | $17.77 | 56,274.62 shares | $17.78 | +$562.75 ✅ |
| IVZ | $31.22 | 32,031.39 shares | $31.54 | +$10,250.04 ✅ |
Net Total Loss: −$2,056.80
Some key takeaways:
- Total invested: $4,000,000 across all four positions
- Net loss: ~−0.05% for the full day  essentially flat
- SPY was your biggest loser, giving back $6,566.77 as the market pulled back through the day
- PCG continued its losing trend from the morning trade as well
- HBAN barely squeaked out a gain at just 1 cent per share
- IVZ was again your standout winner, generating $10,250.04 on a 32-cent move
- Compared to your 10:30 a.m. exit scenario (+$11,239.80 profit), selling at close cost you about $13,296  the morning was the better window on this particular day
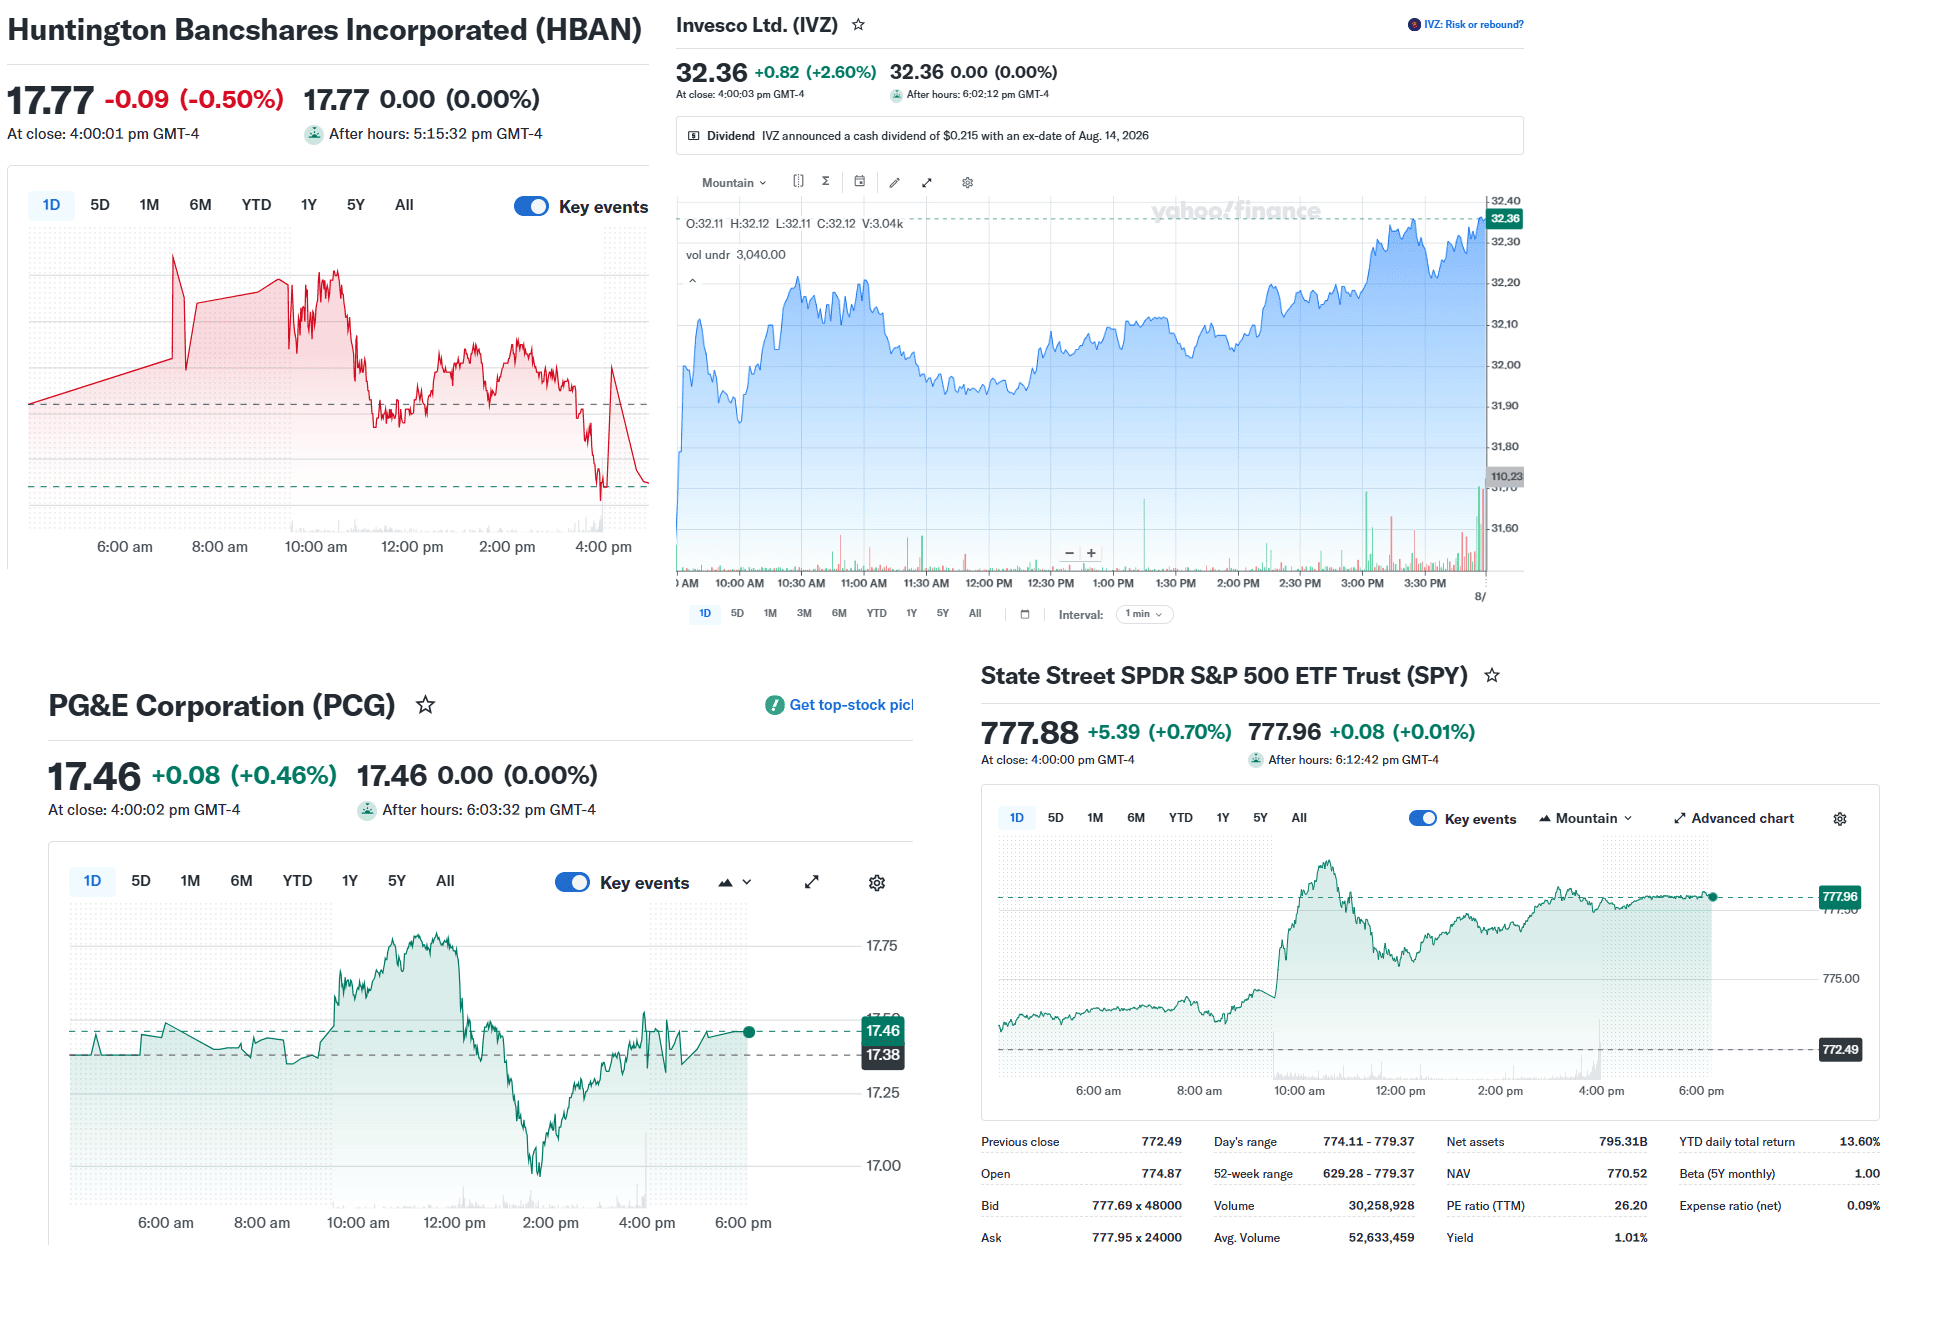
This means our original forecast was 100% correct
Solar weather Details
No solar flares, Cosmic Rays were not increasing, Geomagnetic activity was in the sweet spot.
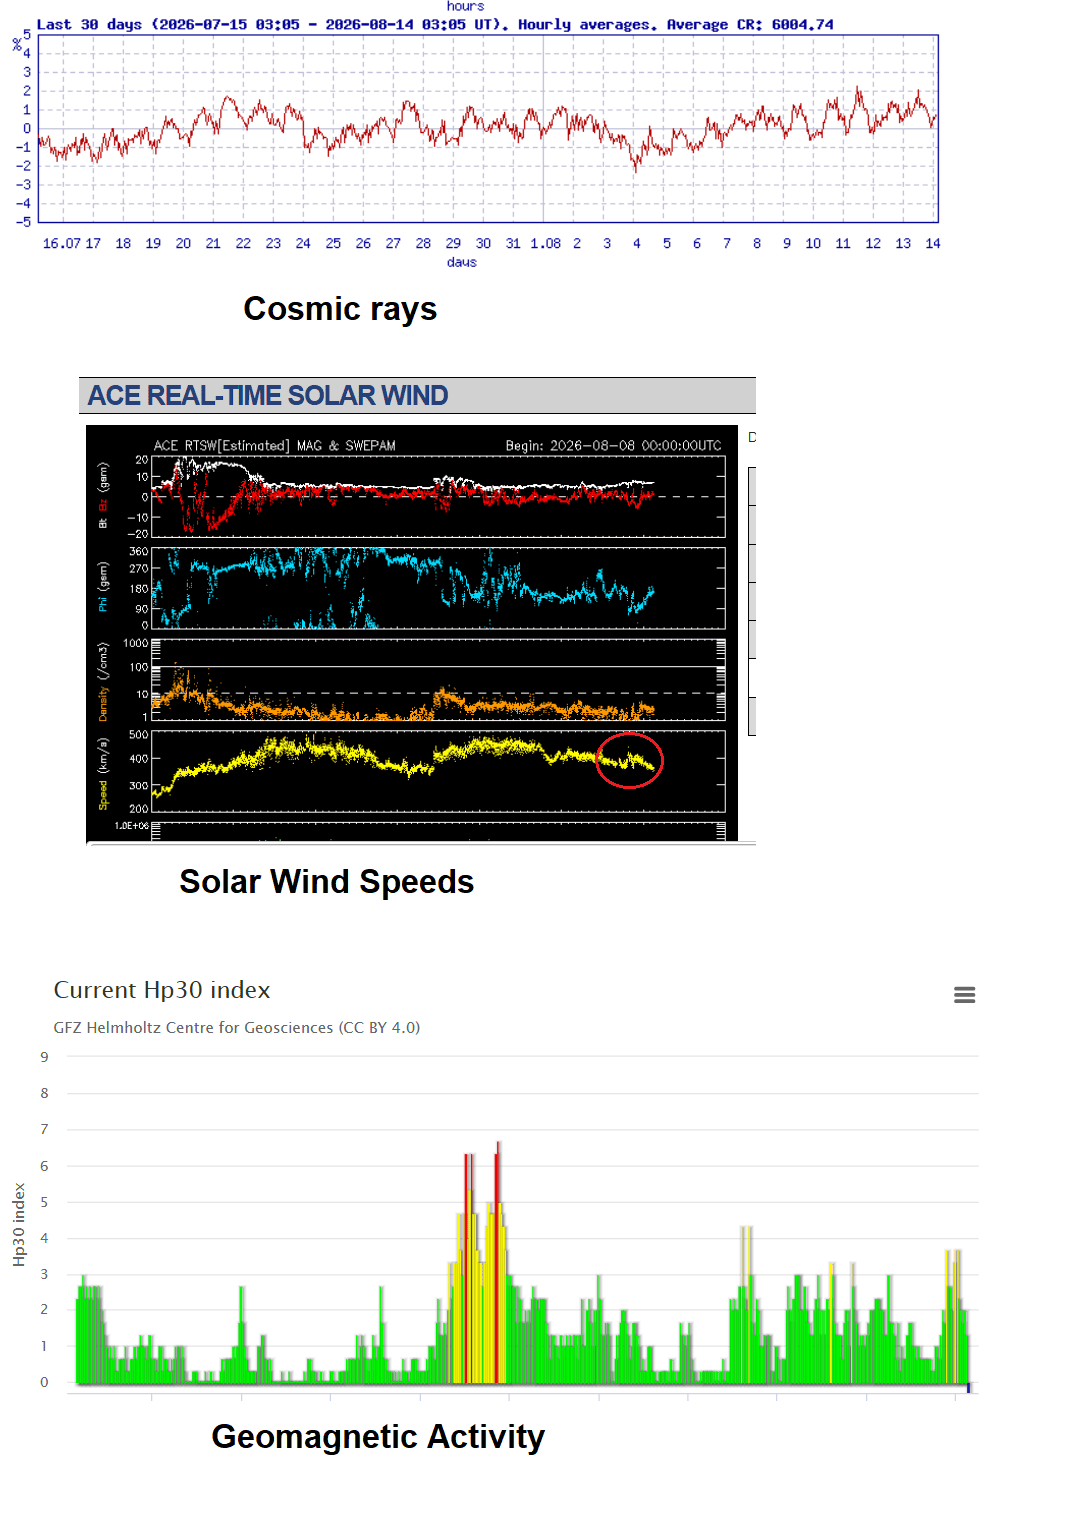
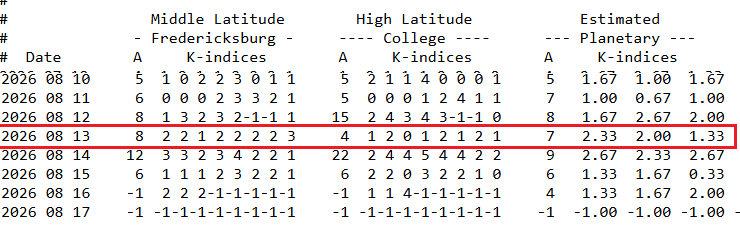
When we look at the NOAA geomagnetic activity, we see that it was lower than usual with higher activity the next day. This may have been the source of interferrence. However this small increase in interferrence proves our technology is starting to overcome these small variables.
Go to Original Data Output
.......................
Data
results are posted to this page between 8 & 12 hours BEFORE the
NYSE Stock Market opens on the day of the beta test.
Important Notice: You may need to refresh this page or clear out your web brower cache to review the latest information posted to this page.
All beta test dates are subject to change depending upon specific solar weather conditions, which can vary. See the analysis page for further info.

DO NOT BUY ANY STOCKS SHOWN ON THIS WEBSITE AS THIS IS AN EXPERIMENTAL / TESTING PROJECT UTILIZING QUANTUM ENTANGLEMENT TECHNOLOGY THAT IS IN THE TESTING PHASE. WE ARE NOT CERTIFIED FINANCIAL PLANNERS NOR RECOMMEND FINANCIAL ADVICE - - - -- - - IN THE FUTURE WHEN THIS TECHNOLOGY MATURES AND CONSISTENT REPEATABLE RESULTS ARE OCCURING FOR A MINIMUM OF 3 TO 6 MONTHS, THAN WE WILL BEGIN PHASE 2.